las nubes, yo las odio
Clouds are a nuisance to anyone working with satellite data. They get between the earth’s surface and a satellite’s sensor, blocking the majority of energy that is bounced back into space. Removing clouds algorithmically from a stack of satellite imagery is one of the most common forms of data cleaning in remote sensing, and makes it possible to produce, if you merge that stack together, a ‘cloud-free’ view of the earth’s surface.
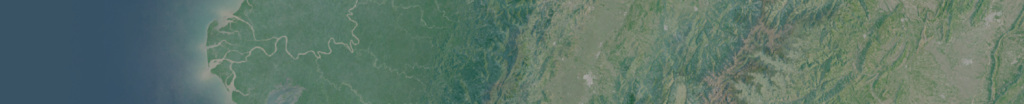
To go from this…
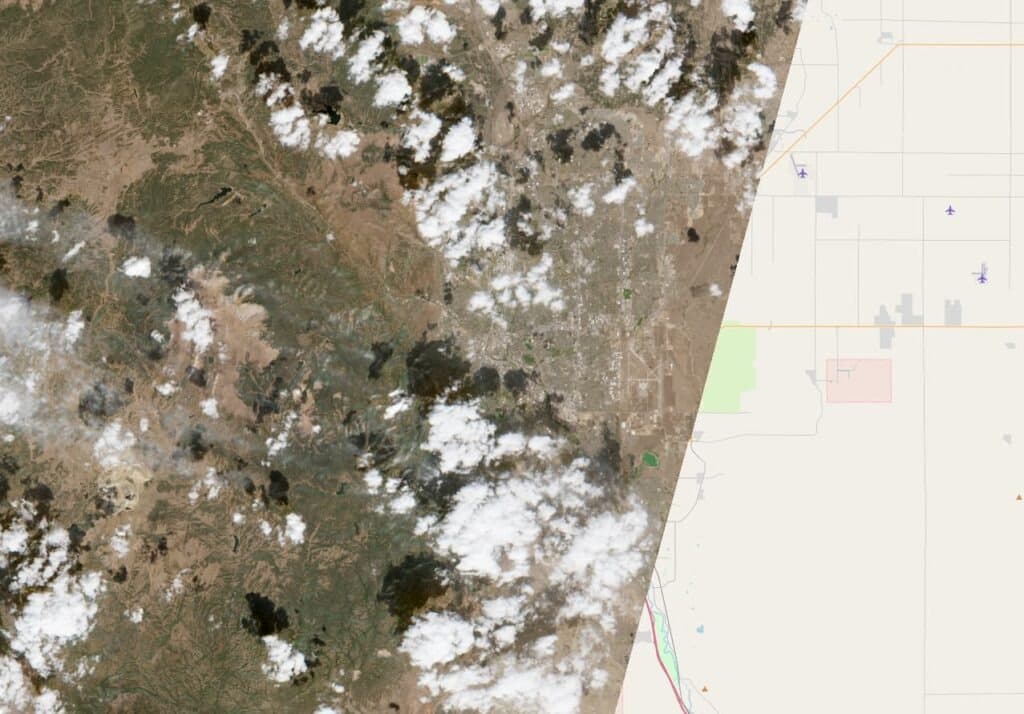
…to this:
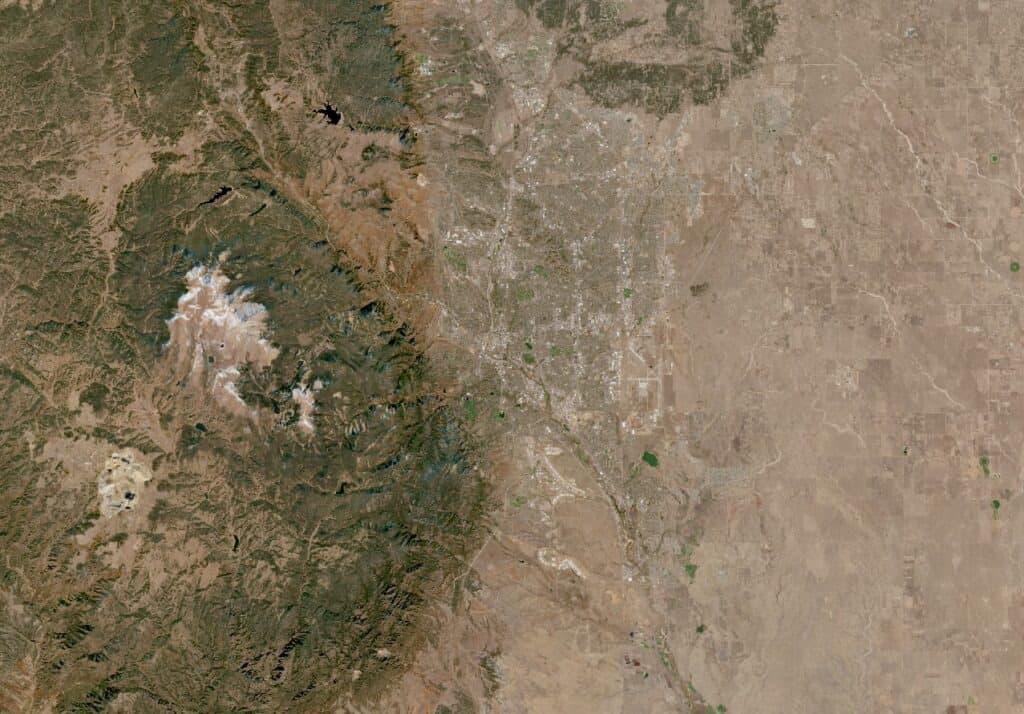
Making a cloud-free mosaic is one of the first things I learned when I took my first (and only) remote sensing class, and it’s something I return to repeatedly to refine my skills. Of course, how easy it is to remove clouds from a stack of satellite imagery depends heavily on where you are.
Naturally, I had an idea to test my skills out by writing a script for the cloudiest place on earth, but where is that?
It is hard to get exact records but there are clear global hotspots. I picked some out using ERA5 data through the excellent Copernicus Climate Atlas (which you can view here)…
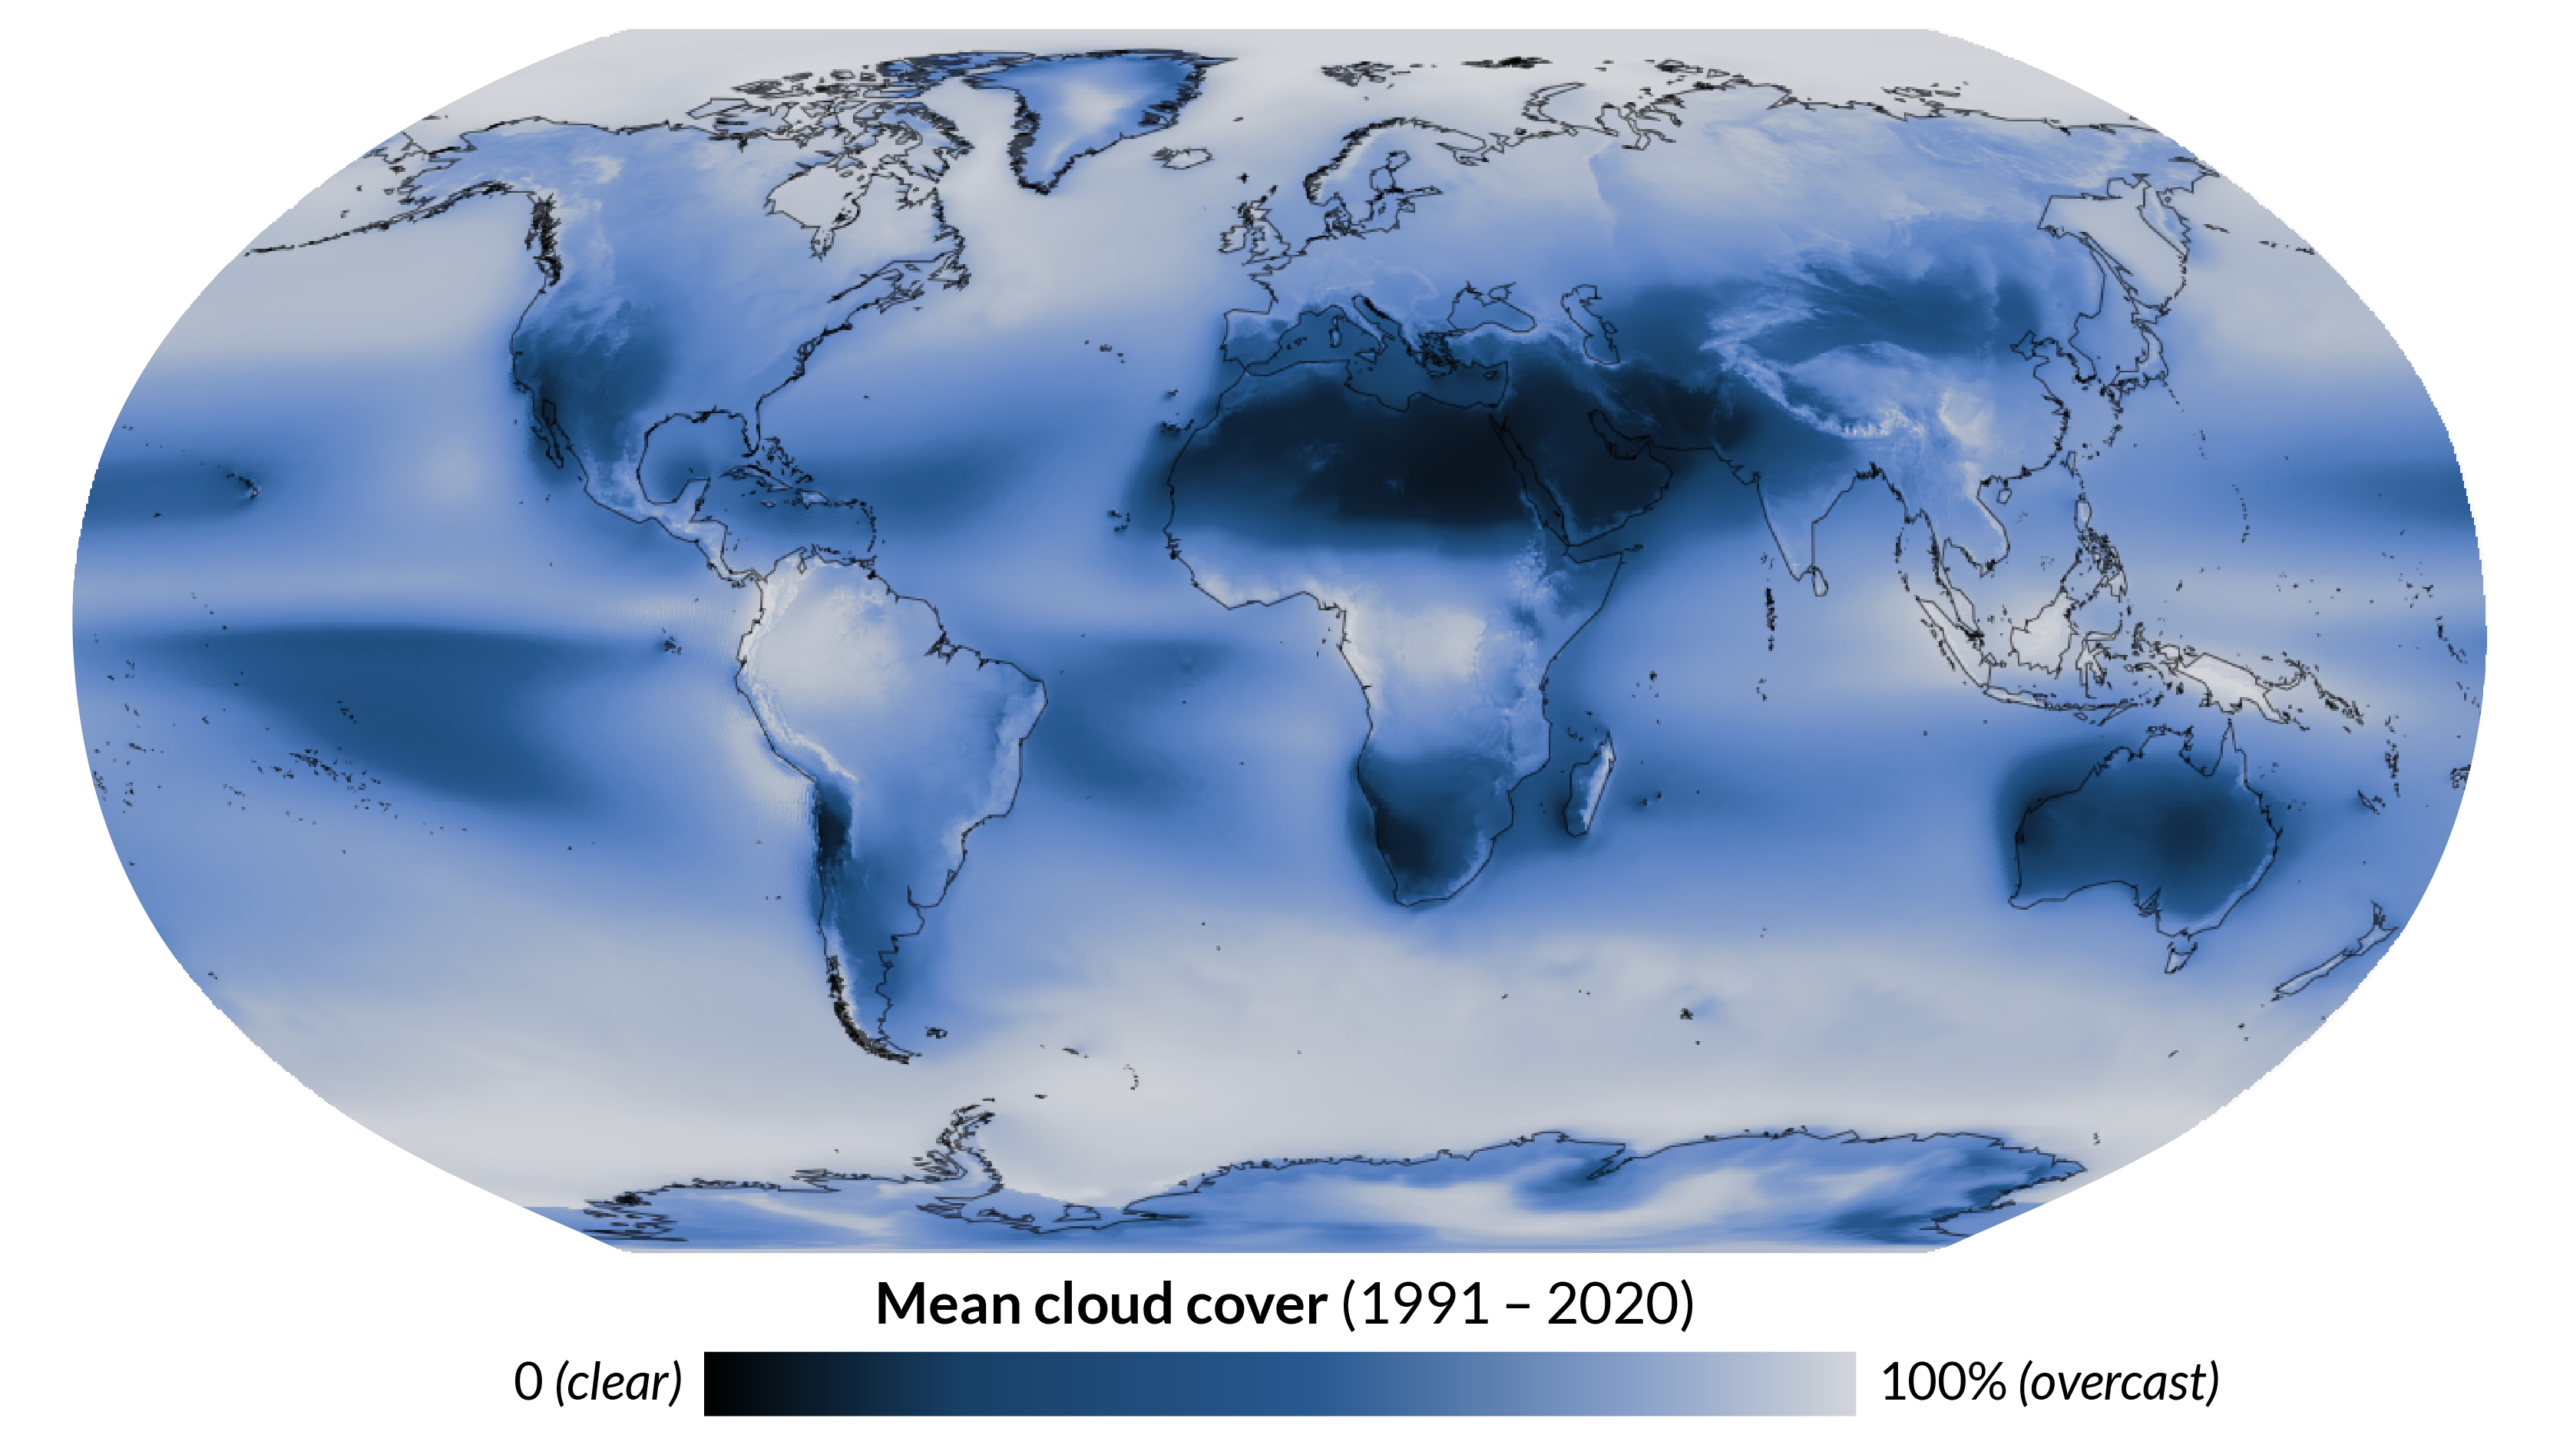
Note: I added in my own legend/s for clarity
Northwestern South America, the Gulf of Guinea, insular Southeast Asia, and the poles are clear winners, but this leaves a lot of potential options. If we also look at global precipitation, which is a good proxy for misty, overcast conditions, we see that list dwindle even further…
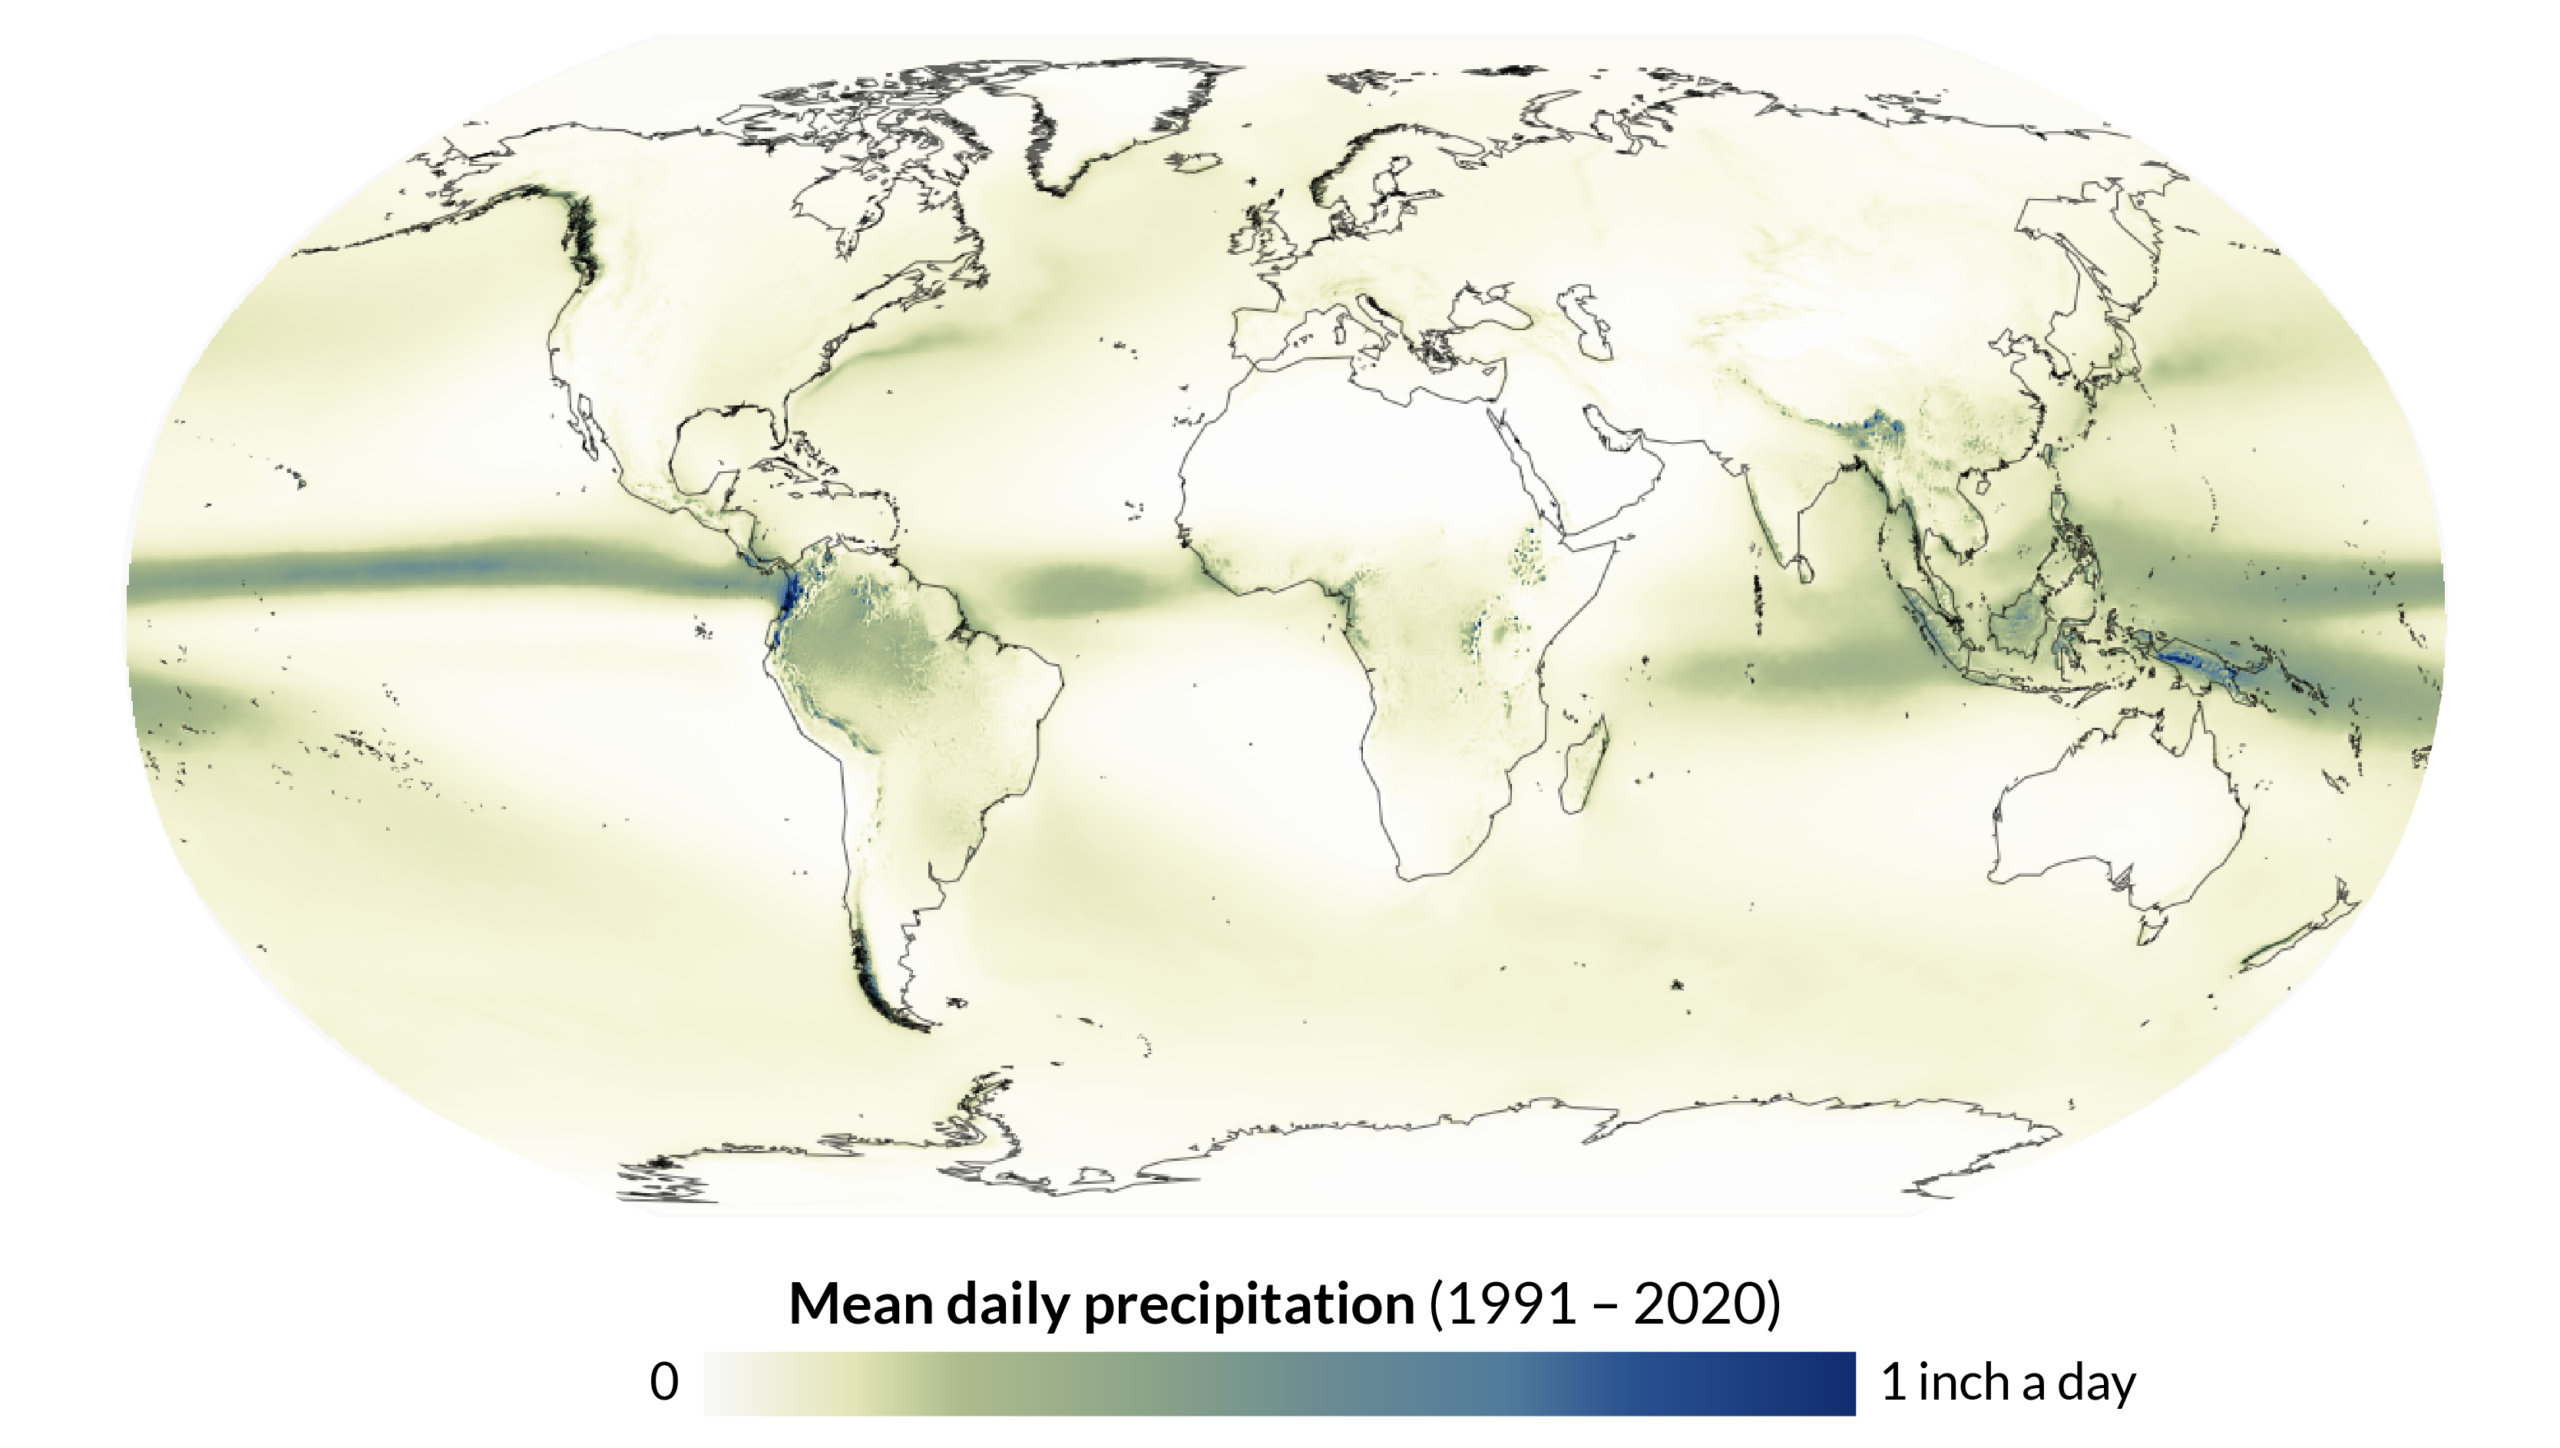
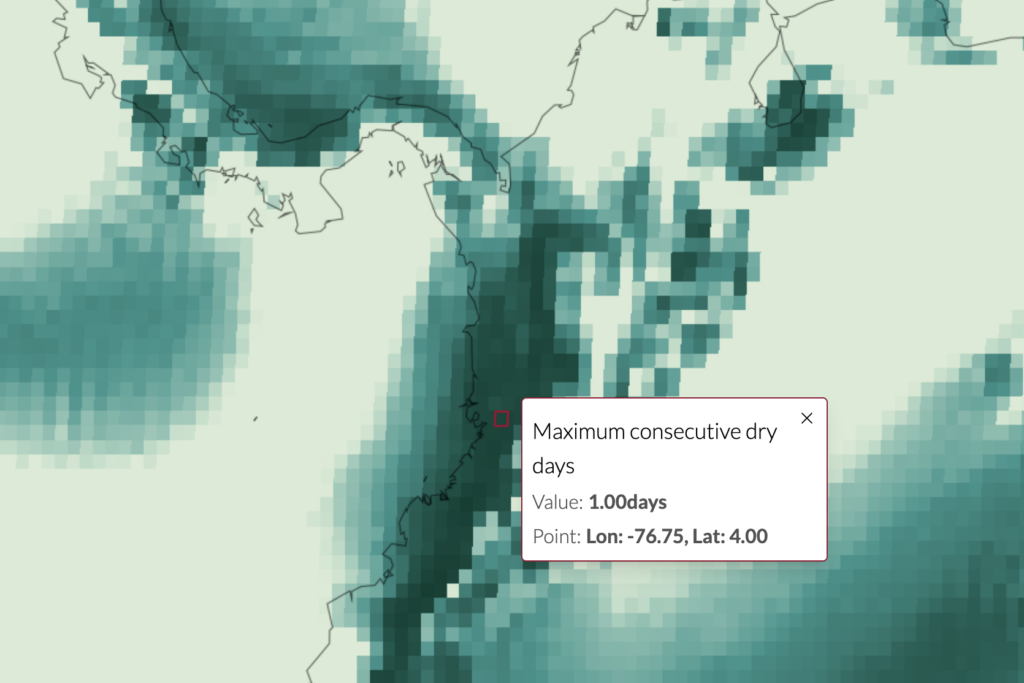
The pacific coast of Colombia sits at the far end of a long tongue of precipitation that leaves it with few competitors (most notably New Guinea). In fact, on a closer look, this region has points where there are at most, a single dry day recorded in the last 30 years of data…
I then remembered that while looking in Google Maps over the years, I had noticed spots where the Google mosaicing algorithm was clearly struggling. If you zoom in you may notice some of them…
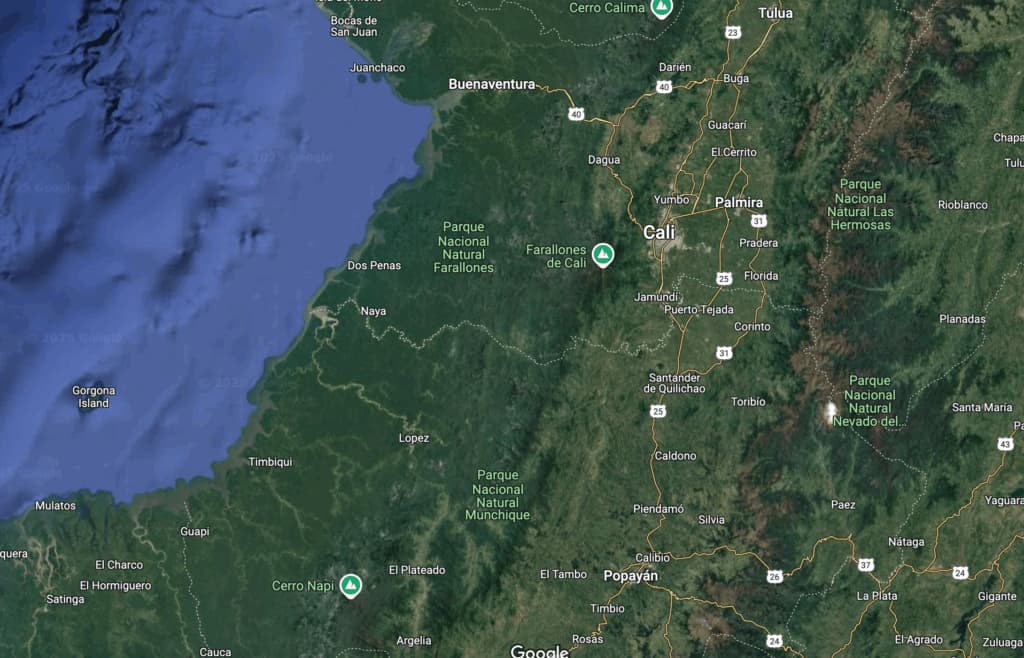
Notice this distinct whiter strip, on the western slopes of the mountains, facing the ocean…
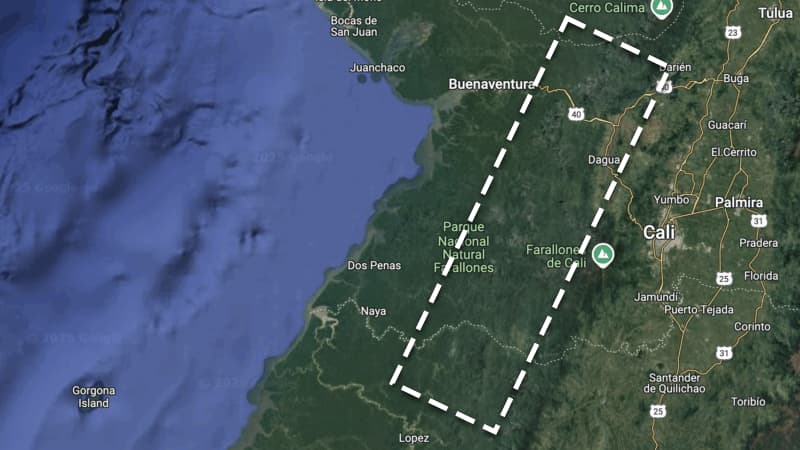
If we move in closer,
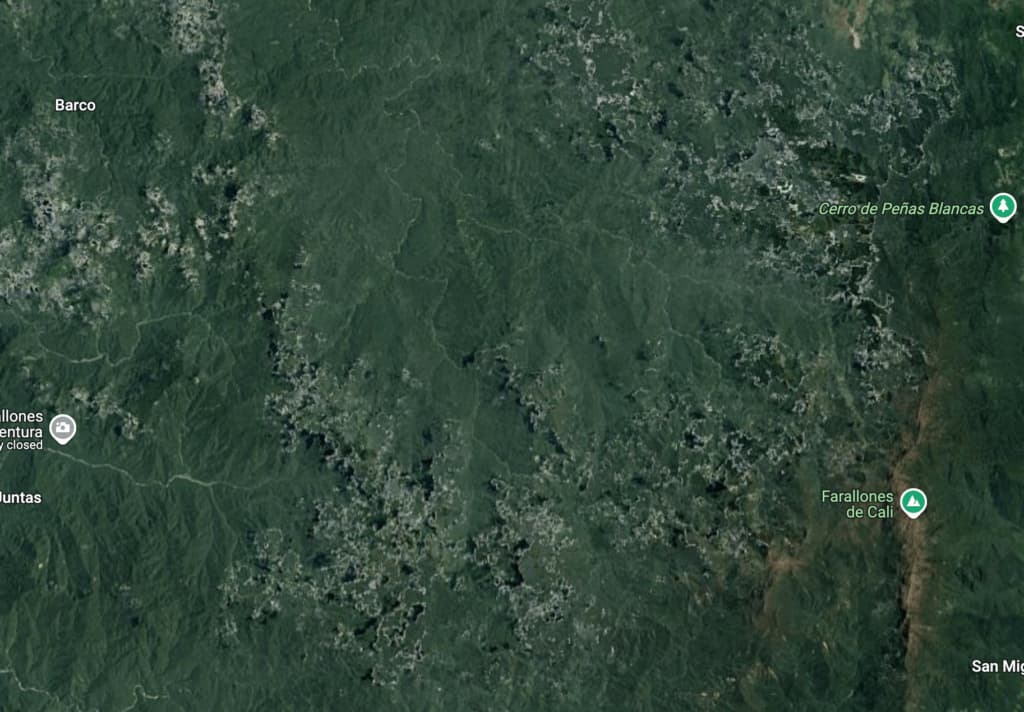
See that white mottling west of the Farallones de Cali?
These irregular patches of white and black are a clear tell that whatever algorithm google was using ran out of good imagery to use for these areas, producing artifacts.
Even the Amazon rainforest itself, on the other side of the Andes, while having some areas where clouds have made it into the mosaic, does not suffer from these ugly data voids:
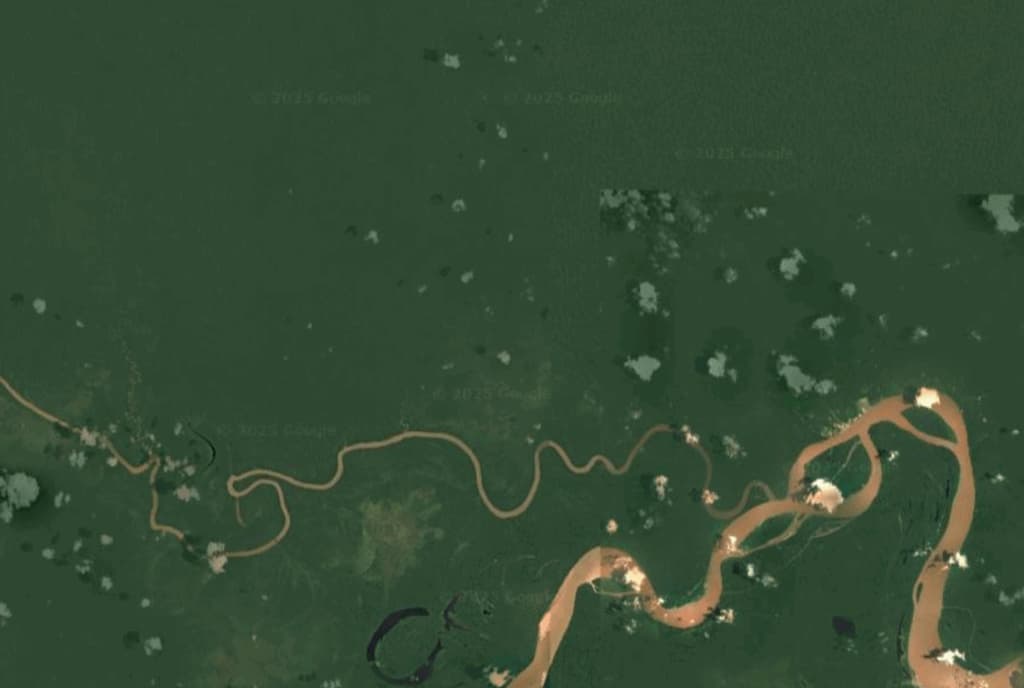
This is a clear tell we are dealing with an area where something unique is happening.
In about March 2025, I decided to try to make my satellite mosaic of this region – called the Chocó. I presented my first map in October, and it is only now in December 2025 I am finally talking about it all.
To understand how it took me the better part of a year to work my way through this, we first have to discuss what the Chocó precisely is, and why is it so wet?
Navigating this article
I wrote this blog post as I was making the map, and my product at the end, did not much match what I was thinking it was going to be at the beginning.
I have decided aside from minor re-writes, to keep that original flow so you follow along in the same process of discovery I did, but to make it easier to tackle I have broken it into sections based on the general stage of production I was in at a given time.
Table of Contents
- Introduction (you are here)
- El Chocó
- Making Mosaics
- Interpolation
- Making the Map
- Labelling and Research
- Cartografía en Español
Next section: El Chocó